If your PDF has a text layer, stop reading and use pdfplumber or Excel's Get Data from PDF. Both are free, both are accurate on ruled tables, and nothing in this article will beat them. Check first: select a number inside the table in Preview, and if it highlights, you are done.
This article is about the other case. A scan, a photo, or a screenshot has no text layer, every coordinate-based extractor returns nothing, and the job falls to OCR. I ran three ordinary scanned tables through Apple's Vision recognizer, Tesseract 5.5.3 and ZenOCR's AI mode. Every output below is pasted verbatim. The app is on the homepage.
First, find out which kind you have
python3 -c "import pdfplumber,sys; print(len(pdfplumber.open(sys.argv[1]).pages[0].extract_text() or ''))" file.pdf
Zero means a scan. Anything above a few hundred means a digital PDF and the free route applies.
Everything below was scanned at 300 DPI, which is the default on most flatbed scanners and phone scanning apps. The AI-mode column is ZenOCR running DeepSeek-OCR-2 Standard locally on an M2 MacBook Air. I ran two of these pages through both the shipping app and a standalone harness and the output was byte-identical, so these are the app's results rather than an approximation of them.
What actually goes wrong
The complaints cluster in the same place. In r/dataengineering: "3rd party Python packages (pdfplumber, tabula): results were not good enough, these packages couldn't extract tables neatly in consistent manner. They were dividing values/labels into chunks and etc." The same thread adds the qualifier that matters: "all these python packages fall short when tables get a bit complicated in terms of structure."
A round-up in the same subreddit rates Tabula the best of six tools for tables, then adds the catch: "It struggles with scanned PDFs."
And from r/excel, the version most people actually live: "I'm trying to get a file converted to excel but all the tables are in an image within the pdf. I know that adobe pro can convert it to excel but the data is so distorted (numbers separated by '|' in consistently, merged cells, weird characters, titles inconsistent)"
Two separate failures hide in there: the tools that need a text layer, and the tools that read the characters but lose the grid. The second one is subtler and it is what the test below is about.
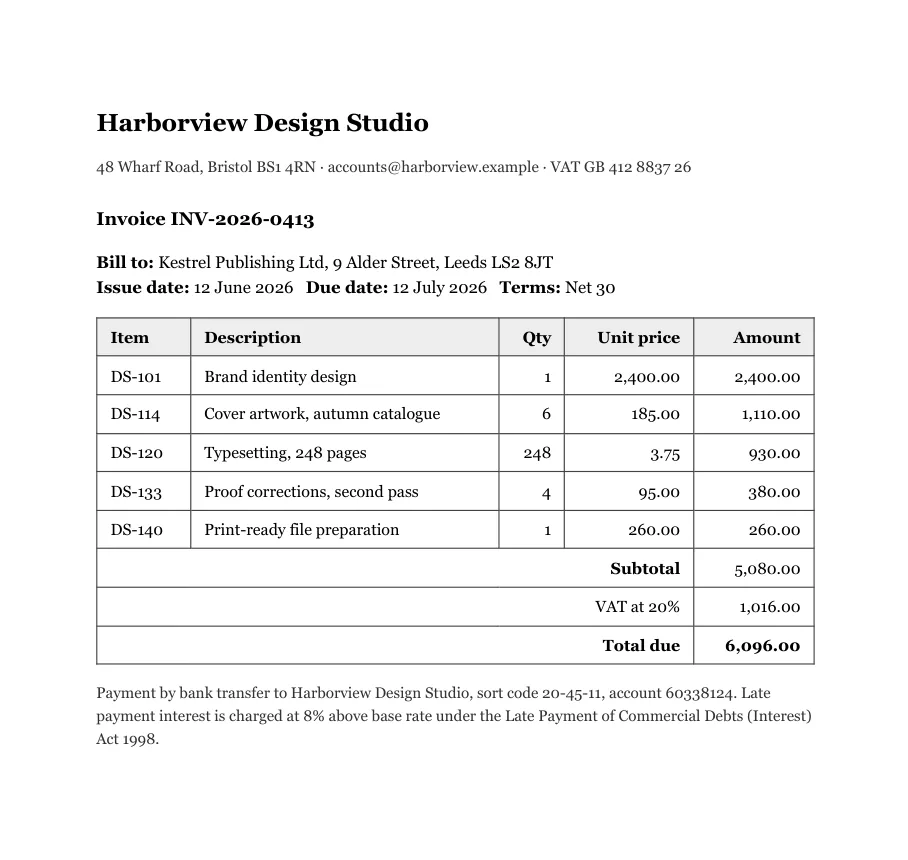
Table 1: an ordinary invoice
Item
Description
Qty
DS-101
DS-114
DS-120
DS-133
DS-140
Brand identity design
Cover artwork, autumn catalogue
Typesetting, 248 pages
Proof corrections, second pass
Print-ready file preparation
1
Every character is correct. The item codes arrive as one block, then the descriptions as another. No price is attached to the line it belongs to.
<table><tr><td>Item</td><td>Description</td><td>Qty</td><td>Unit price</td><td>Amount</td></tr><tr><td>DS-101</td><td>Brand identity design</td><td>1</td><td>2,400.00</td><td>2,400.00</td></tr><tr><td>DS-114</td><td>Cover artwork, autumn catalogue</td><td>6</td><td>185.00</td><td>1,110.00</td></tr><tr><td>DS-120</td><td>Typesetting, 248 pages</td><td>248</td><td>3.75</td><td>930.00</td></tr><tr><td>DS-133</td><td>Proof corrections, second pass</td><td>4</td><td>95.00</td><td>380.00</td></tr><tr><td>DS-140</td><td>Print-ready file preparation</td><td>1</td><td>260.00</td><td>260.00</td></tr><tr><td colspan="4">Subtotal</td><td>5,080.00</td></tr><tr><td colspan="4">VAT at 20%</td><td>1,016.00</td></tr><tr><td colspan="4">Total due</td><td>6,096.00</td></tr></table>Every row intact, every figure correct, and the three summary rows carry colspan 4 because that is what they do on the page.
Tesseract did better than Vision on structure here and worse on completeness: the two line items it managed came back as whole rows with their figures attached, and it silently dropped the header row, the other three items and all three summary rows.
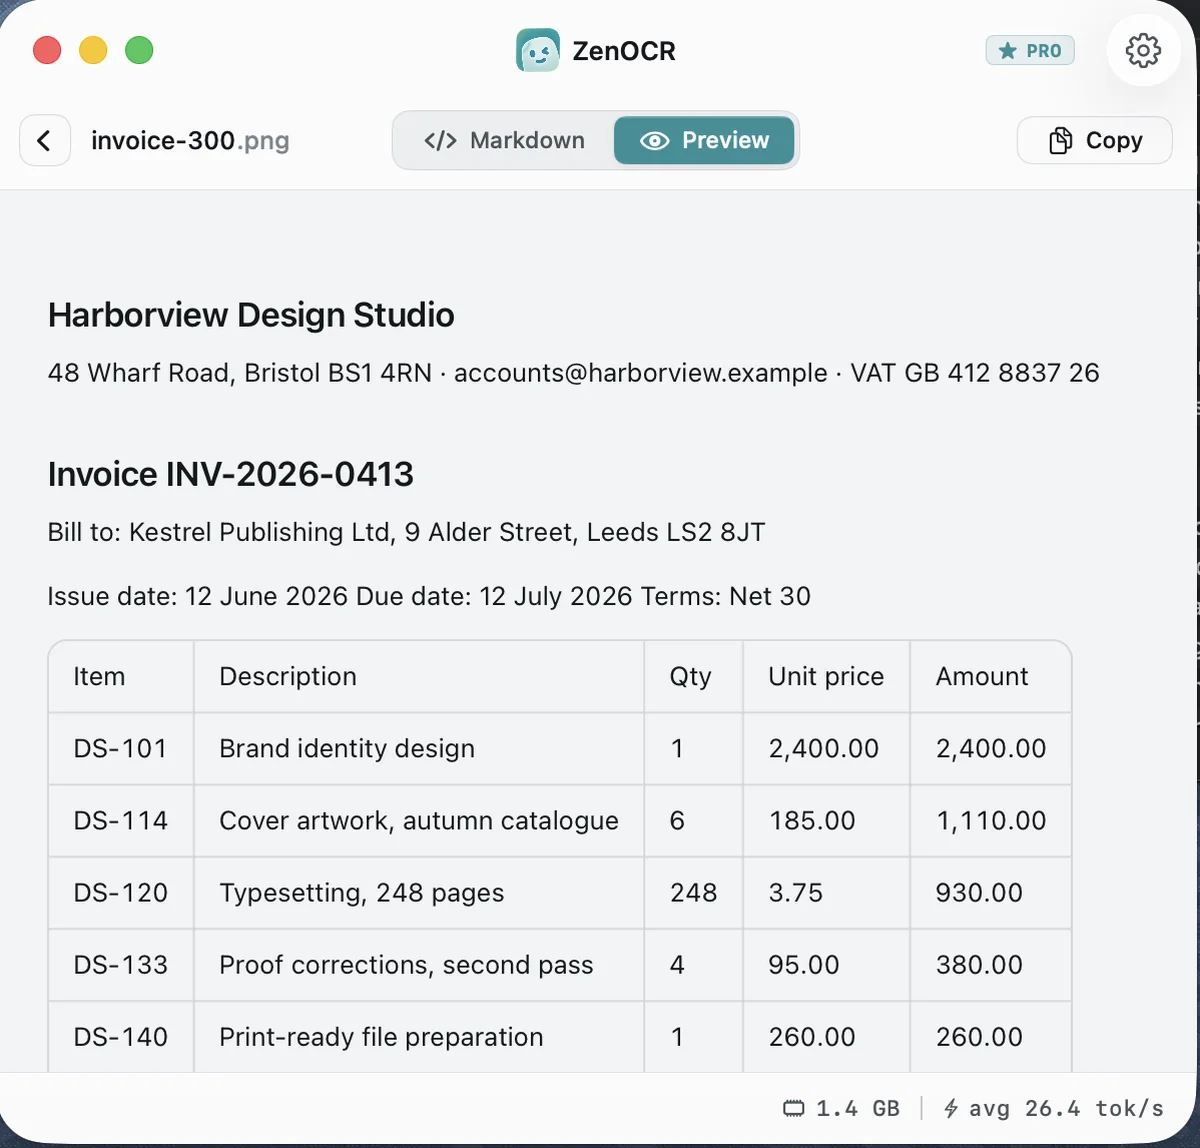
Table 2: merged cells
Benefit
category
Service
Preventive care
Diagnostics
Prescriptions
Hospital
Annual health
check
Vaccinations
Blood tests
X-ray
MRI and CT
Generic
Branded
Inpatient stay
What you pay
In network
No charge
No charge
20%
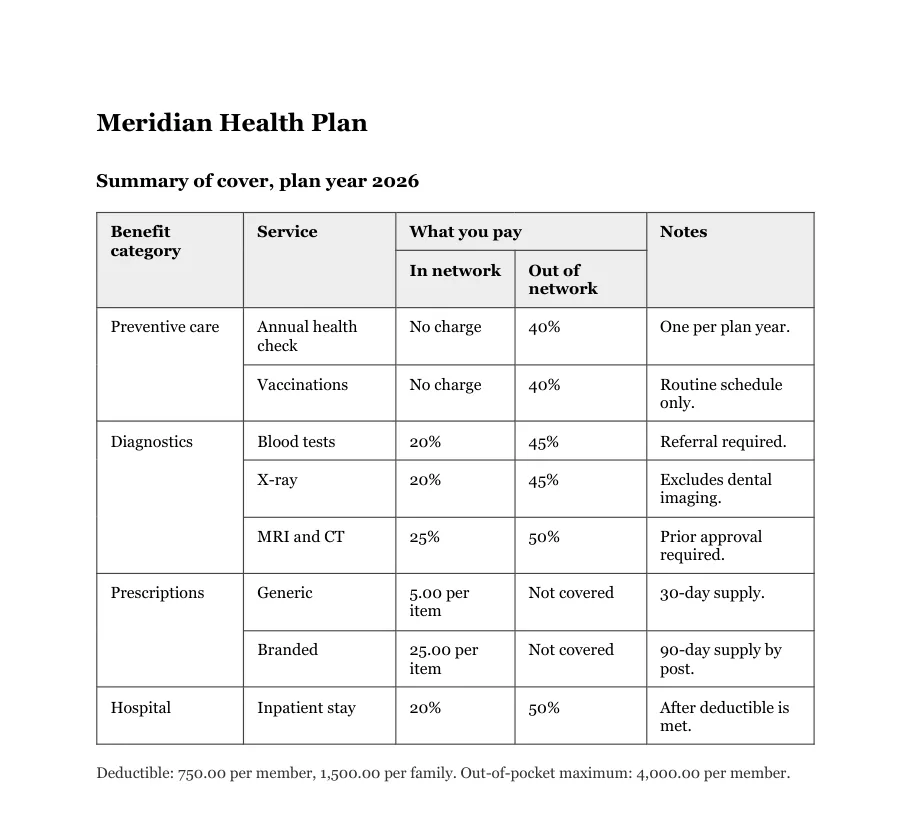
The four merged row labels come out together, then all nine service names, then all the percentages. Reconstructing which percentage belongs to which service is guesswork.
<table><tr><td rowspan="2">Benefit category</td><td rowspan="2">Service</td><td colspan="2">What you pay</td><td rowspan="2">Notes</td></tr><tr><td>In network</td><td>Out of network</td></tr><tr><td rowspan="2">Preventive care</td><td>Annual health check</td><td>No charge</td><td>40%</td><td>One per plan year.</td></tr><tr><td>Vaccinations</td><td>No charge</td><td>40%</td><td>Routine schedule only.</td></tr><tr><td rowspan="3">Diagnostics</td><td>Blood tests</td><td>20%</td><td>45%</td><td>Referral required.</td></tr><tr><td>X-ray</td><td>20%</td><td>45%</td><td>Excludes dental imaging.</td></tr><tr><td>MRI and CT</td><td>25%</td><td>50%</td><td>Prior approval required.</td></tr></table>Correct. rowspan 2 on the outer headers, colspan 2 on What you pay, rowspan 3 on Diagnostics. Trimmed here for width; the remaining rows are equally correct.
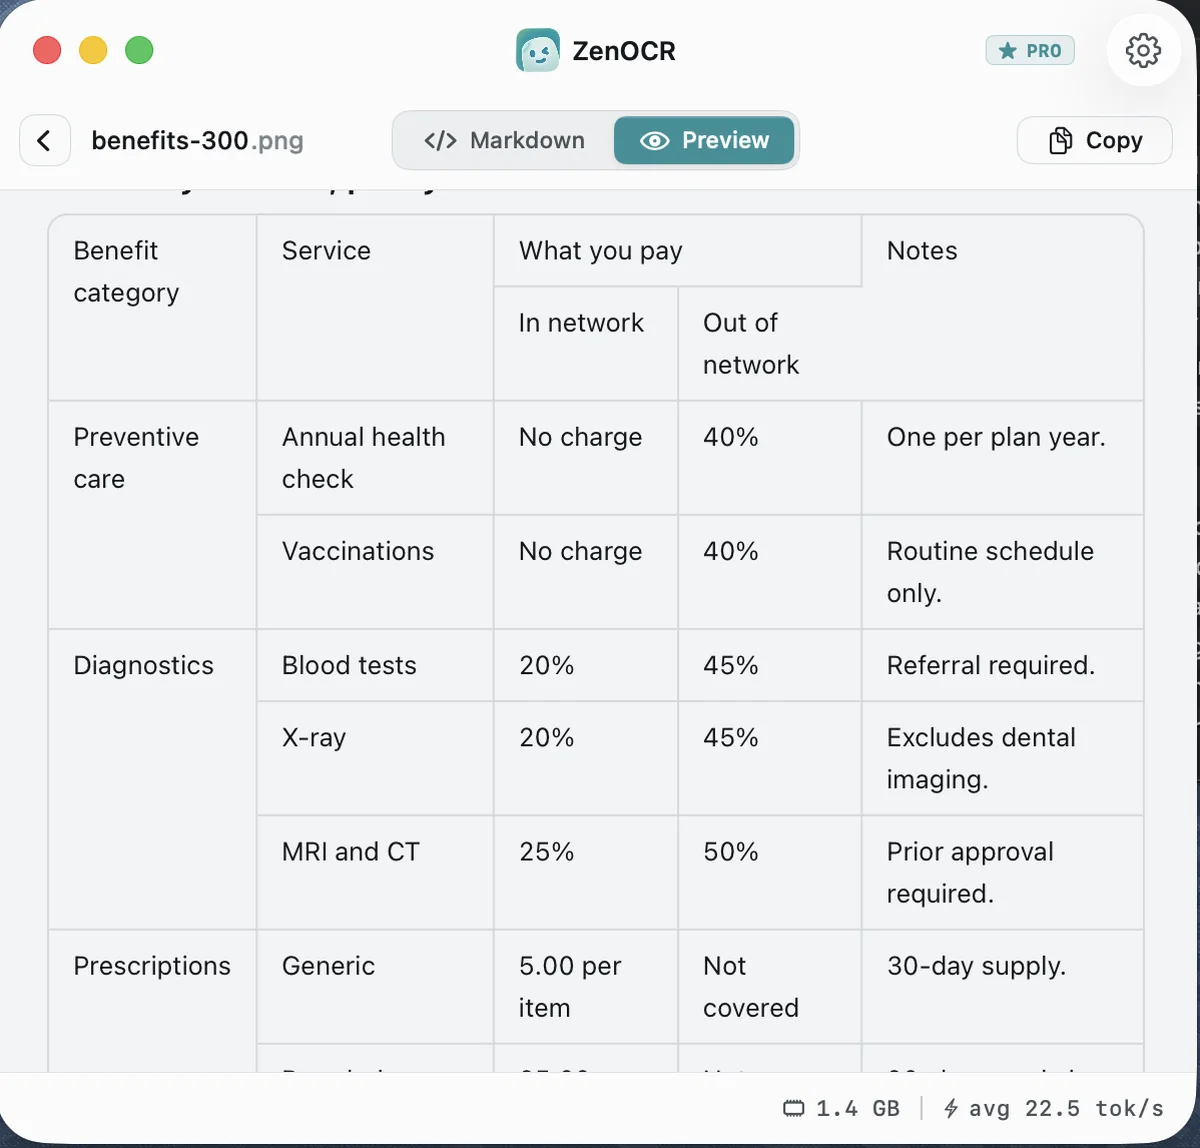
Table 3: dense numbers
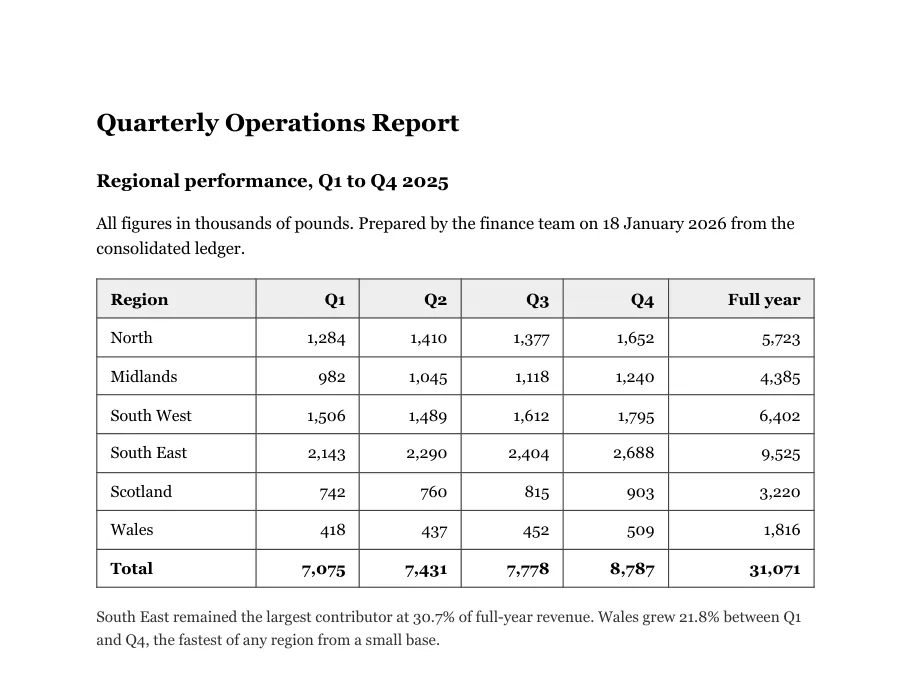
Apple Vision returned every region name as one block and every Q1 figure as another:
Region
North
Midlands
South West
South East
Scotland
Wales
Total
Q1
1,284
982
1,506
2,143
742
418
All 42 figures are read correctly and none of them is in a row. This is the failure that looks like success when you glance at it.
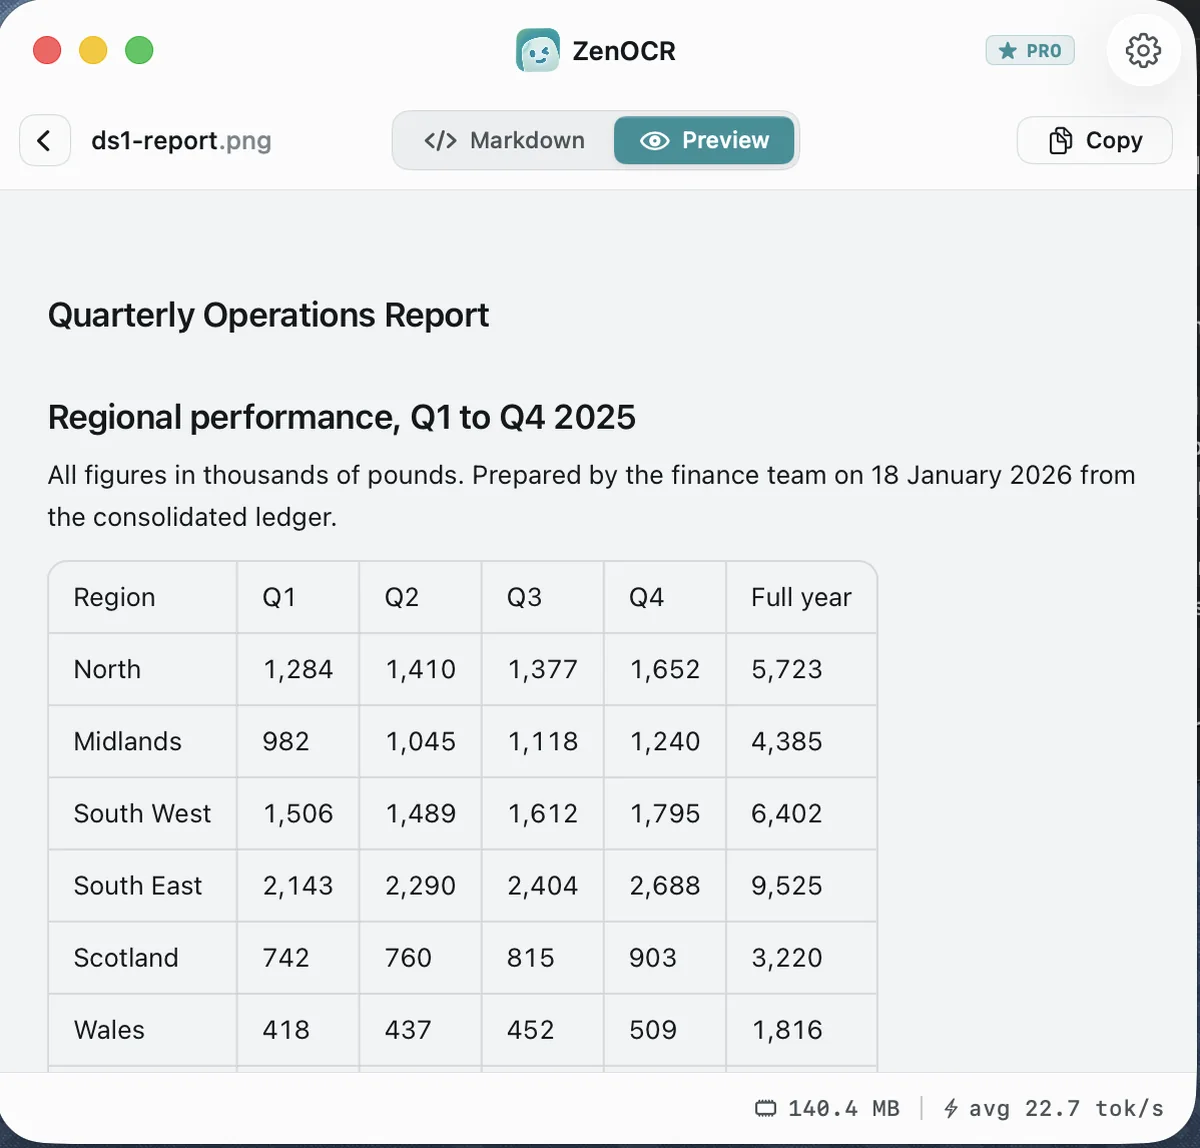
<table><tr><td>Region</td><td>Q1</td><td>Q2</td><td>Q3</td><td>Q4</td><td>Full year</td></tr><tr><td>North</td><td>1,284</td><td>1,410</td><td>1,377</td><td>1,652</td><td>5,723</td></tr><tr><td>Midlands</td><td>982</td><td>1,045</td><td>1,118</td><td>1,240</td><td>4,385</td></tr><tr><td>South West</td><td>1,506</td><td>1,489</td><td>1,612</td><td>1,795</td><td>6,402</td></tr><tr><td>South East</td><td>2,143</td><td>2,290</td><td>2,404</td><td>2,688</td><td>9,525</td></tr><tr><td>Scotland</td><td>742</td><td>760</td><td>815</td><td>903</td><td>3,220</td></tr><tr><td>Wales</td><td>418</td><td>437</td><td>452</td><td>509</td><td>1,816</td></tr><tr><td>Total</td><td>7,075</td><td>7,431</td><td>7,778</td><td>8,787</td><td>31,071</td></tr></table>All 42 figures correct and in the right cells, totals row included.
A harder one, and a different model
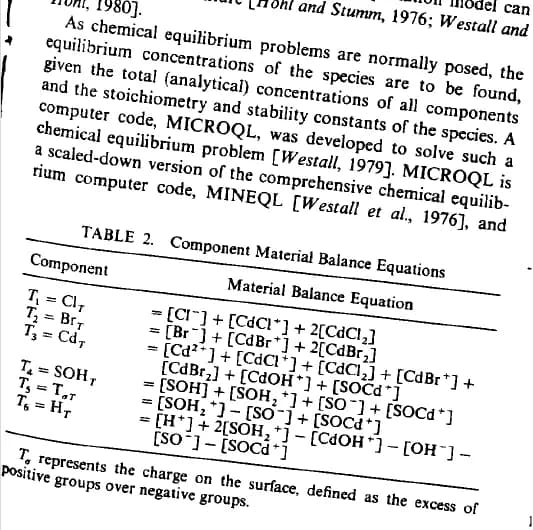
Tesseract produced E = EI") + poaey~ and got worse from there. Vision read the surrounding paragraph well and returned two of the six equations. On this page the other model in the app, GLM-OCR, was the better choice: it rebuilt all six rows with correct charges and subscripts as LaTeX inside a table.
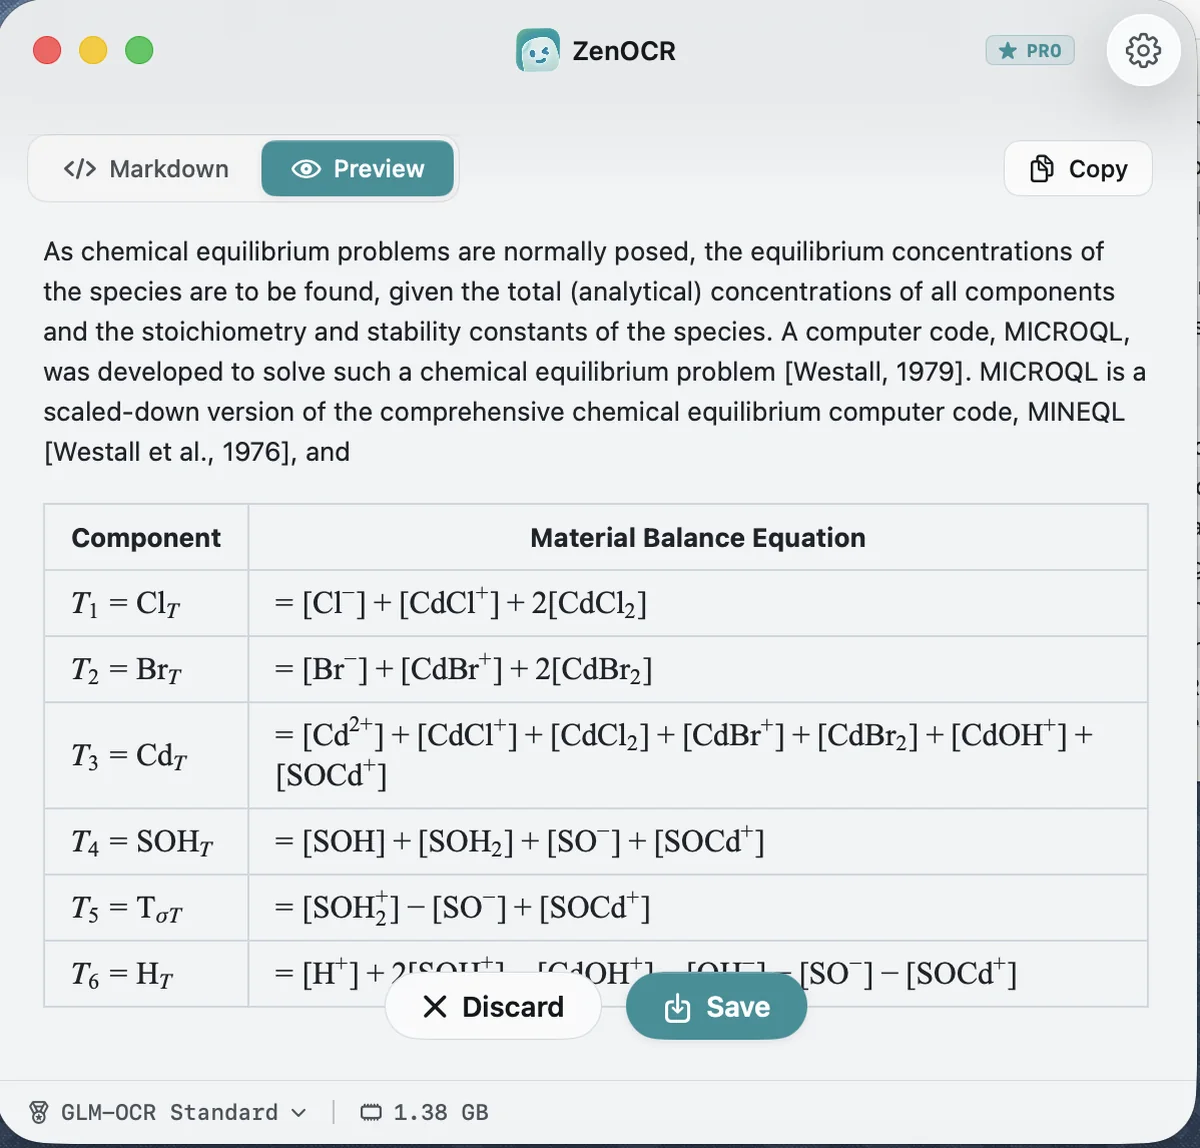
That split is worth knowing before you start. The app ships two models and the picker says what each is for: DeepSeek-OCR-2 for clean documents, GLM-OCR for almost anything, which in practice means the damaged and awkward pages. Every clean-scan result above is DeepSeek. The crooked photocopy is GLM.
Why the rows are what break
Tabula, Camelot, pdfplumber and Excel's PDF import all read text objects the PDF already stores, each with a coordinate, and infer the grid from ruling lines or whitespace gaps. Give them a scan and there are no text objects, so they return nothing.
Apple Vision and Tesseract solve a different problem. They find regions of text in an image and recognize the characters in each. They are very good at that. What neither does is decide that this region and that region are the same row of the same table, because a table is not a visual property of a text region, it is a relationship between regions. So the output comes back in whatever order the layout pass produced, which for a column-heavy page is column order.
A vision-language model reads the page as a page first: this is a header band, this cell is wider than the two below it, this label governs the three rows to its right. Then it recognizes the characters and writes the relationship down as rowspan and colspan. That is the entire difference, and on a scanned table it is the difference between data and a word list.
Which tool for which table
| What you have | Use | Cost |
|---|---|---|
| Text layer, ruled table | pdfplumber, or Excel Get Data from PDF | Free |
| Text layer, plain columns | pdfplumber, then check the column count | Free |
| Scan or photo, simple table | Any OCR, then rebuild rows by hand | Free, and tedious |
| Scan or photo, more than three columns | A layout-aware model | Paid |
| Scan or photo, merged or nested headers | A layout-aware model. Nothing else keeps the merges | Paid |
| Confidential file, any of the above | Anything that runs on your machine, not an online converter | Varies |
Doing it on a Mac
Drop the file onto ZenOCR and press Start OCR. For a clean scan leave the model on DeepSeek-OCR-2; for a photocopy or a damaged page switch to GLM-OCR in the picker at the bottom left.
One setting matters for tables. In Settings, turn off Keep formatting when copying. With it on, copying converts the result to rich text for Mail and Word, and that conversion flattens merged cells. With it off you get the raw Markdown and HTML exactly as the model produced it, rowspan and colspan intact, which is what Numbers and Excel want on paste.
Multi-page PDFs run as one job and files queue behind each other, so a folder of scanned statements goes in as a batch.
What this will not do
- It does not write anything back into the PDF. Text, Markdown and HTML come out. If you need the file to stay a PDF and become searchable, that is Preview's File > Export with Embed Text, or Acrobat. Covered in the Preview article.
- It does not export .xlsx. The output pastes into Numbers and Excel as a grid. That is one keystroke, not a converter.
- It will not beat a free tool on a digital PDF. If your file has a text layer, pdfplumber is more accurate and costs nothing. That is the first section of this article for a reason.
- Check the totals. Every figure above came out right, and a model is still a model. On a table you are going to act on, check the row that matters.
- macOS 14 or later, Apple Silicon for AI mode. No Windows, no iPad, no web version. Intel Macs get Fast mode, which is Apple Vision.
The short version
Coordinate-based extractors are free and correct, and they need a text layer you may not have. Apple Vision is free and correct at the character level, and it returns your table as a list of columns. The gap between those two is where a layout-aware model earns its keep, and it is a large gap: on all three scans above, the difference was not a few percent of accuracy but whether the numbers were still attached to their rows.
Related: PDF to Markdown on a Mac for whole pages rather than tables, PDF to LaTeX when the equations matter, and what Preview's built-in OCR already does free. The app is on the ZenOCR homepage.